價格:免費
更新日期:2016-12-21
檔案大小:571.4 KB
目前版本:1.1
版本需求:需要 iOS 8.0 或以上版本。與 iPhone、iPad 及 iPod touch 相容。
支援語言:英語

If you have a more mathematical interest in seeing graphically how
- Amount Borrowed
- Monthly Payments
- Length of Mortgage/Loan (term)
- Interest rate
interact with each other then Loan Graph is for you.

If you like graphs, then 'Loan Graph mortgage payment calculator' (Loan Graph for short) will help you to SEE how varying one thing changes another, not just numerically, but seeing how quickly curves gets steeper etc. or at what point there is a more significant divergence away from the 'zero interest comparison' line.
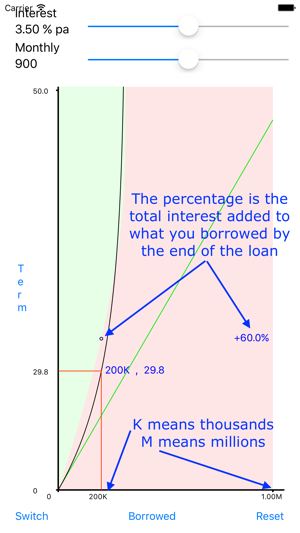
Loan Graph will also let you SEE how the 'cost' of a loan is affected by changing a parameter (the cost being the total interest you pay over the whole loan repayment), and tapping/dragging on the graph lets you 'read off' numerical values.
Loan Graph helps you SEE how the calculations work out for YOUR details so you can judge where the balance lies in a far more informed way. A dynamically changing graph as you move a slider lets you see the rate at which things change and how close you might be to saving lots or to a disaster situation.
By tapping the axes you can quickly change what you graph. The mortgage (loan) Interest rate is always set as a slider at the top, but you have complete flexibility between graphing:
- Amount borrowed
- Length of loan (years)

- Monthly payments
For example, visually see at what point reducing your monthly payments starts dramatically impacting the length of the loan and the total interest you end up having to pay.
Or see it the other way around. Does increasing the length of the loan really reduce your payments by that much? It might to start with, but there comes a point (that you can 'see' on a graph) when the gain may not be worth it. Meanwhile you can see on the right how the 'cost' of the loan (in interest payments) rises.
The screenshots above show you the controls (it also forms a kind of help/manual). With very few buttons to press or slide you can do a lot of experimenting to explore your options and get a real 'feel' for what loan (mortgage) you will be most happy with.
When you home in on your chosen mortgage details, make sure you slide the interest bar enough to experiment with rising interest rates to know how close (or hopefully far) you are from run-away bad situations.
Limitations:

Loan Graph mortgage payment calculator is designed to give a good 'feel' for the parameters. Some values are rounded to aid clarity of display, and some assumptions and detail in calculations will be different to those that a lender might use. It has only been designed to give a useful general indication of costs. You should always get and use a specific quote from the lender and double-check the price yourself before acting on the information. We cannot accept responsibility for any errors (please report faults using the 'support' link).
The interest is fixed at a single rate for the whole term. Whilst this may not reflect many 'real' mortgage situations, it can be a useful tool to see where a loan is initially headed, particularly for fixed interest rate loans (mortgages).

支援平台:iPhone, iPad
